The Chande Kroll Stop indicator allows traders to identify a potential stop loss for a long or short position. A stop loss is a type of order that literally allows you to stop your loss at a certain price point.
But where should you place a stop loss? That’s where the Chande Kroll indicator comes in. The technical indicator allows you to safeguard your capital by ensuring that trades remain open only as long as they move in the desired direction.
Traders do not need to individually reset the limit order since it is automated, like the fixed stop-loss. A trader should take long bets whenever prices pass the blue line. However, when prices cross the red line, a trader should terminate the short positions.
History of Chande Kroll Stop
Tushar Chande and Stanley Kroll, two technical analysts (Canadian bankers), created the Chande Kroll Stop strategy. Chande and Kroll are financial industry experts who pioneered prominent indicators like the Aroon Indicator, StochRSI, Chande Momentum Oscillator, and VIDYA.
They first mentioned their indicator in the book “The New Technical Trader – Boost Your Profit by Plugging into the Latest Indicators” in 1994, which became one of the most famous books and had a considerable impact on trade methods.
The Chande Kroll Indicator can be used to set a stop loss for any financial instrument like stocks, commodities, currencies, and derivatives, irrespective of whether you’re looking to trade a short or long position.
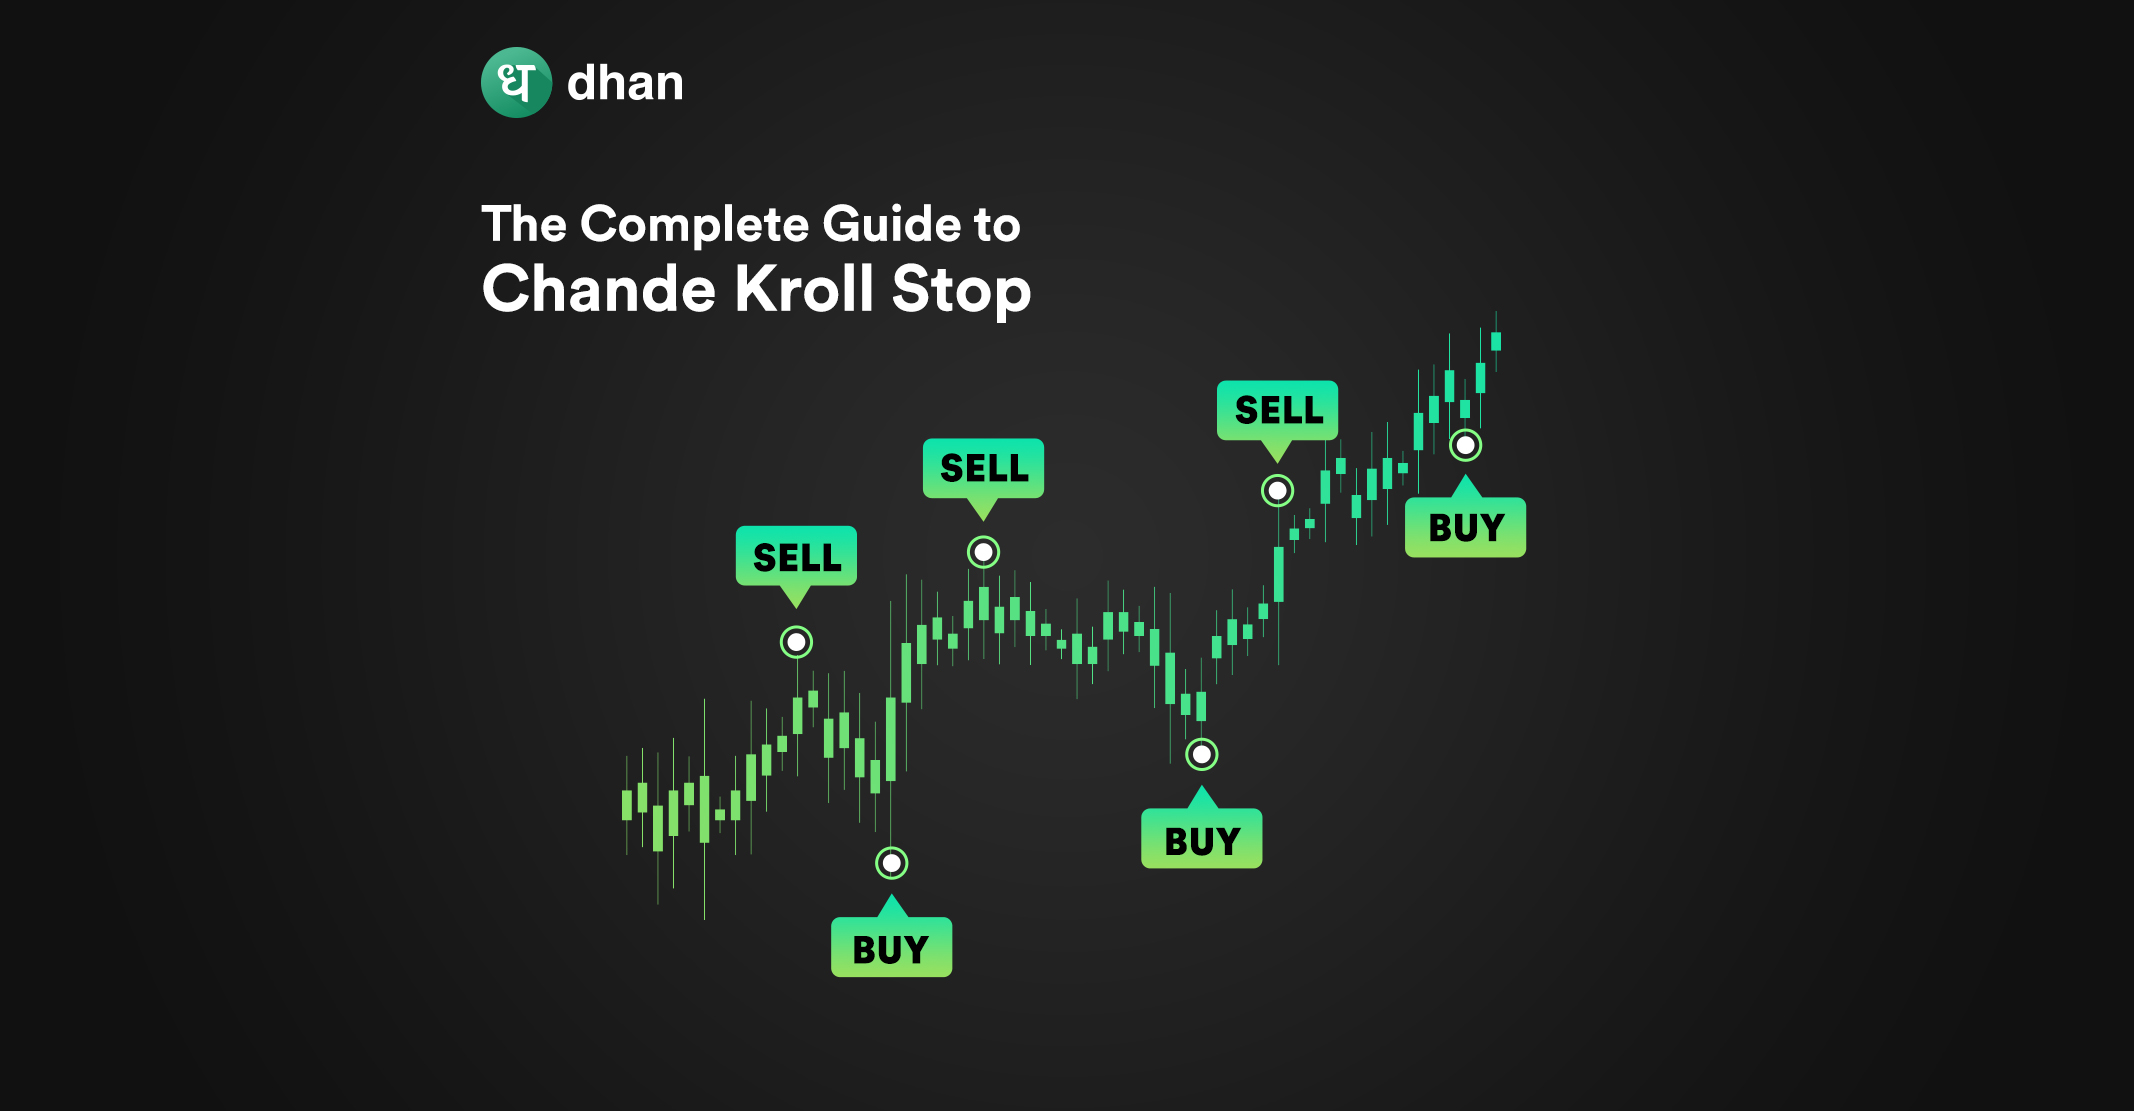
On a candlestick chart, the Chande Kroll Stop will appear as two lines, each in different colors ranging from red, green, or blue superimposed on the candlesticks. The following image will help you visualize what the Chande Kroll Indicator looks like on charts.
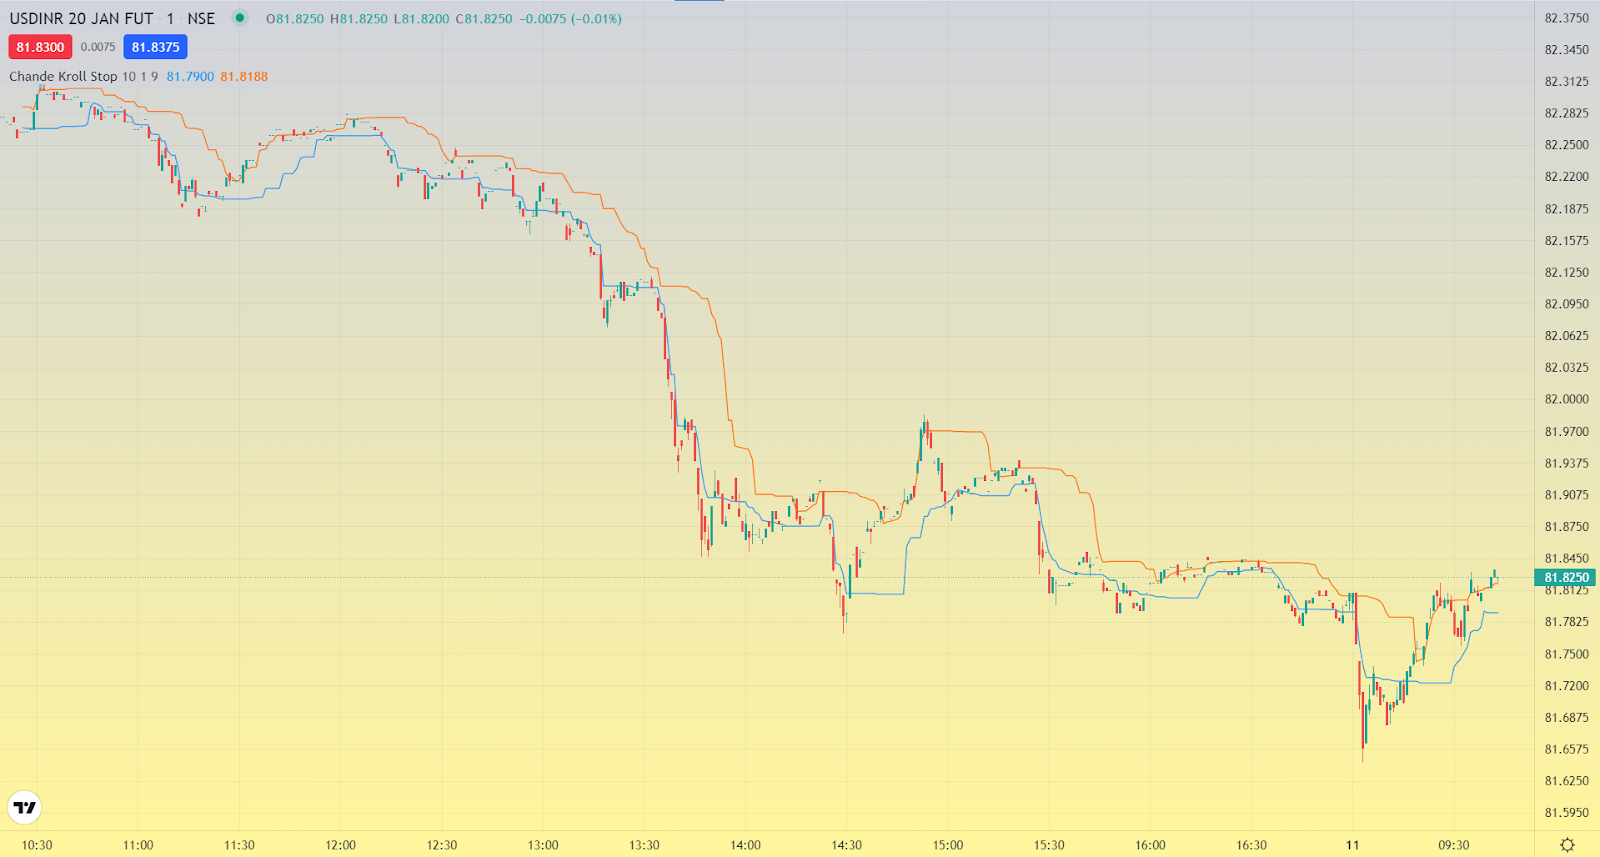
The red line indicates the short position’s stop level, while the green line shows the opposite position’s level, which is the long position’s stop level.
Because the true range determines the Chande Kroll Stop formula, it is characterized as independent of the volatility of the element involved. Speaking of formula, let’s dig into the inner workings of Chande Kroll Stop.
Chande Kroll Stop Calculation and Formula
The Chande Kroll stop formula is obtained by calculating stops for low points and high points of the options graph. Remember that the true range is the absolute value. Also, note the three values indicated below for the true range.
- Current bar low: last bar at the close
- Current bar high: last bar at the close
- Current bar high: current bar low
The stop indicator is based on an instrument’s volatility’s average true range of movements observed in the market. Stops are put underneath or on the peak and bottom of the chart’s last “n” bars.
The difference is related to the average real range on “n” bars, and the numbers obtained are utilized appropriately.
Here is the formula for the Chande Kroll Stop indicator:
- Initial high stop = HIGHEST [p] (high) – x * Average True Range [p]
- Initial low stop = LOWEST [p] (low) + x * Average True Range [p]
- Short stop = HIGHEST [q] (Initial high stop)
- Long stop = LOWEST [q] (Initial low stop)
By the way, the Average True Range is also a technical indicator that you can read about here: The Complete Guide to Average True Range Indicator
How to Use the Chande Kroll Stop Indicator Effectively?
Trading when the stock value is below or above both indicator lines is an ideal way to execute the Chande Kroll Stop strategy. To determine the pattern, it is typically best to trade long-term charts such as the 1W or 1M.
The indicator works on smaller time frames, such as the 12H or 6H, although it is not as thorough and precise as the 1W chart. Here is a list to help you trade using this indicator with ease.
1. Time to Sell
The Chande Kroll Stop has several applications. Traders generally opt to sell when the value passes below both the profit and loss lines. When the price passes above both lines, it is typically a buy signal. If there’s a cross between the Chande Kroll Lines, then it is also a trading signal.
2. Position Awareness
As the price swings sideways, the lines of the Chande Kroll Stop begin flattening out, allowing the price to trade more widely between both lines. Being aware of the line position is crucial to successfully executing a trade.
3. Halting Trends
The Chande Kroll Stop indicator can also be used to halt trend shifts. A new upswing is noted when the green/blue line crosses above the red line. However, a new decline is noted when the red line passes below the green/blue line.
This implies that every trader using this indicator should receive the same information as it provides insight into market-stop losses and profit-taking opportunities.
Conclusion
Executing this Chande Kroll Stop strategy is dependable and valuable for putting stop loss orders and following stops to maximize trading profits and minimize losses.
However, to make the most of the Chande Kroll Stop indicator, traders must understand how and when the red and blue lines cross on each chart and how it affects price action.
You can access Chandle Kroll Stop as well as hundreds of other indicators like Average Directional Index, Aroon, Bollinger Bands, and more for free on Dhan.
Like this? Then you’ll love: