There are three handy tools for identifying a trend including technical indicators, trendlines, and price action. This article will primarily focus on a technical indicator known as the Arnaud Legoux Moving Average (ALMA). Scroll down to know more!
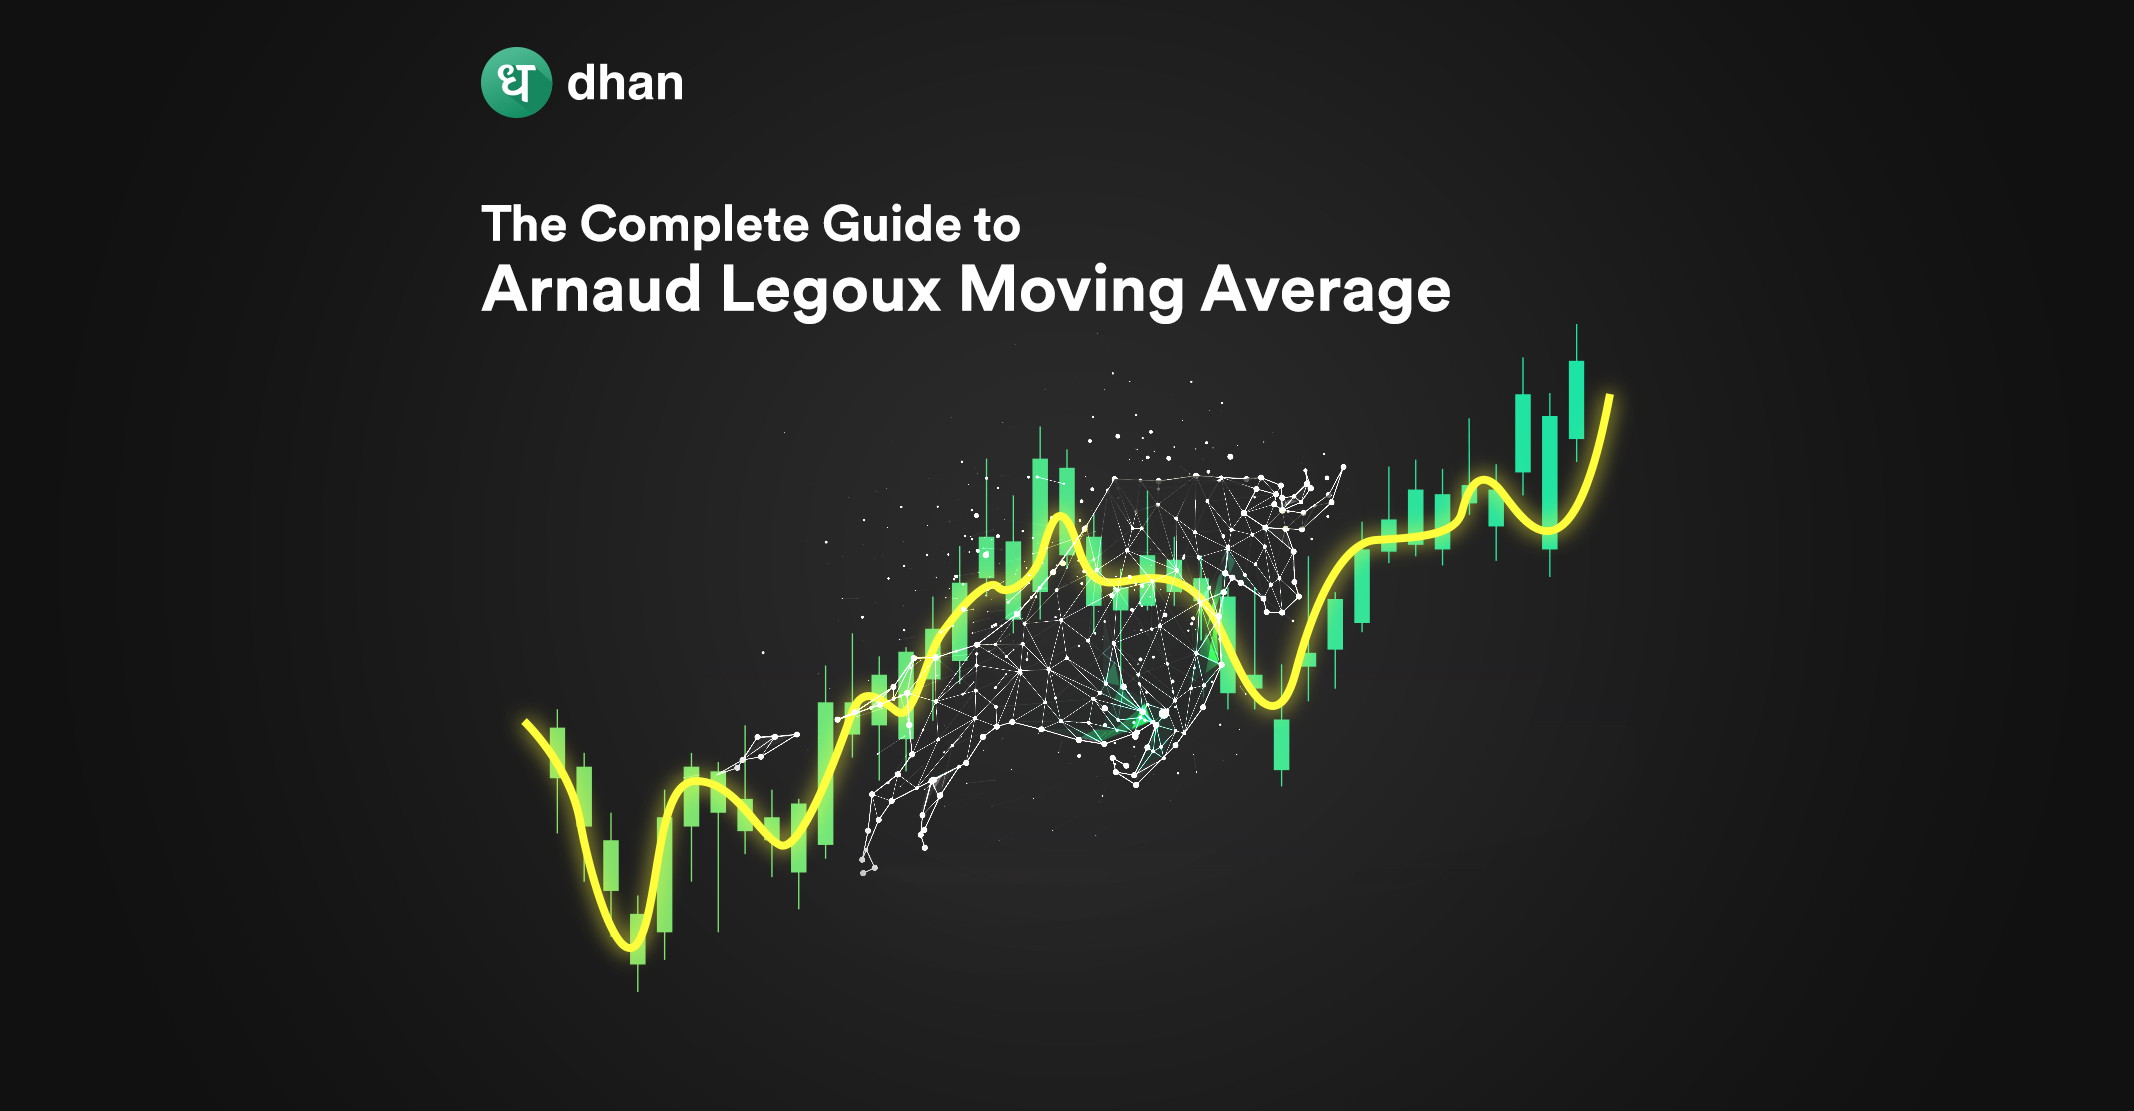
What is the Arnaud Legoux Moving Average Indicator?
The Arnaud Legoux Moving Average (ALMA) is a technical indicator that provides trading signals by identifying trends and trend reversals. At its core, ALMA uses moving averages but historically speaking, moving averages are known to have drawbacks, especially when it comes to accuracy and speed. This includes simple and exponential moving averages.
ALMA reduces the noise that can interfere when using traditional moving averages by calculating each moving average simultaneously, from right to left and the other from left to right.
The Arnaud Legoux Moving Average Indicator thus allows you to weed out false signals from your trading strategy by increasing the amount of data throughput in opposite directions. Other than that, ALMA is more or less similar to other moving averages.
As a result, you as a trader can use ALMA to get better, more accurate insights into price movements. For example, a cross between the price and the ALMA line in charts is a trading signal that you can act upon based on your strategy.
The popular trading indicator ALMA was created in 2009 by Arnaud Legoux to decrease the amount of time that other moving averages took to generate trading signals. The output is derived through a customized formula, which we will discuss below.
Arnaud Legoux Moving Average Formula: How Is It Calculated?
ALMA price trends are based on a weighted sum using a specified duration, standard deviation, and the Gaussian filters. Here is the brief breakdown of all concepts involved in calculating the Arnaud Legoux Moving Average:
1. Standard Deviation
Standard deviation is the square root of the variance between the price patterns’ points. It signifies a statistical concept demonstrating how far prices have changed from their average point.
In the context of ALMA, standard deviation provides outcomes using a price average as a point of reference in which low standard deviations are associated with less volatility and vice versa. It implies a lower risk of capital loss while trading forex, stocks, or assets.
2. Gaussian Filters
Gaussian filters form a characteristic and symmetrical ‘bell curve’ when applied to a graph.
Gaussian filters generate numerical values used to analyze the movement of an asset or outcome of a security after understanding the probability.
Besides the standard deviation and Gaussian Filters, there are 3 variables to consider that describe the Arnaud Legoux Moving Average Formula, including:
A. Window Size
Window Size is the look-back period used to form the basis of ALMA settings. You can take any value of your choice using the ALMA window size. However, it is best to opt for values like 10, 40, 50, 70, 100, or any other based on your chosen time frame. The default value is 9, which means you need to analyze the data by looking at the last 9 candles.
B. Offset
The offset value is a multiplier that signifies the indicator’s alignment to price inclined towards smoothness or responsiveness. The value can range between 1 and 0 (in decimals). However, the default offset value is 0.85.
A price closer to 0 will demonstrate more lag (making it highly smooth), whereas an offset value of 1 will make the indicator follow the price precisely (making it very responsive).
C. Sigma
Sigma represents the filter range. The default value is 6, which means a value lower than 6 will make the ALMA indicator less responsive to price fluctuations. Whereas a value closer to or equal to 6 is said to offer good performance.
How to Use the ALMA Indicator?
There are multiple ways of using this indicator that allows you to trade effortlessly. However, you can use and pair the ALMA indicator with other technical analysis tools to get optimal results.
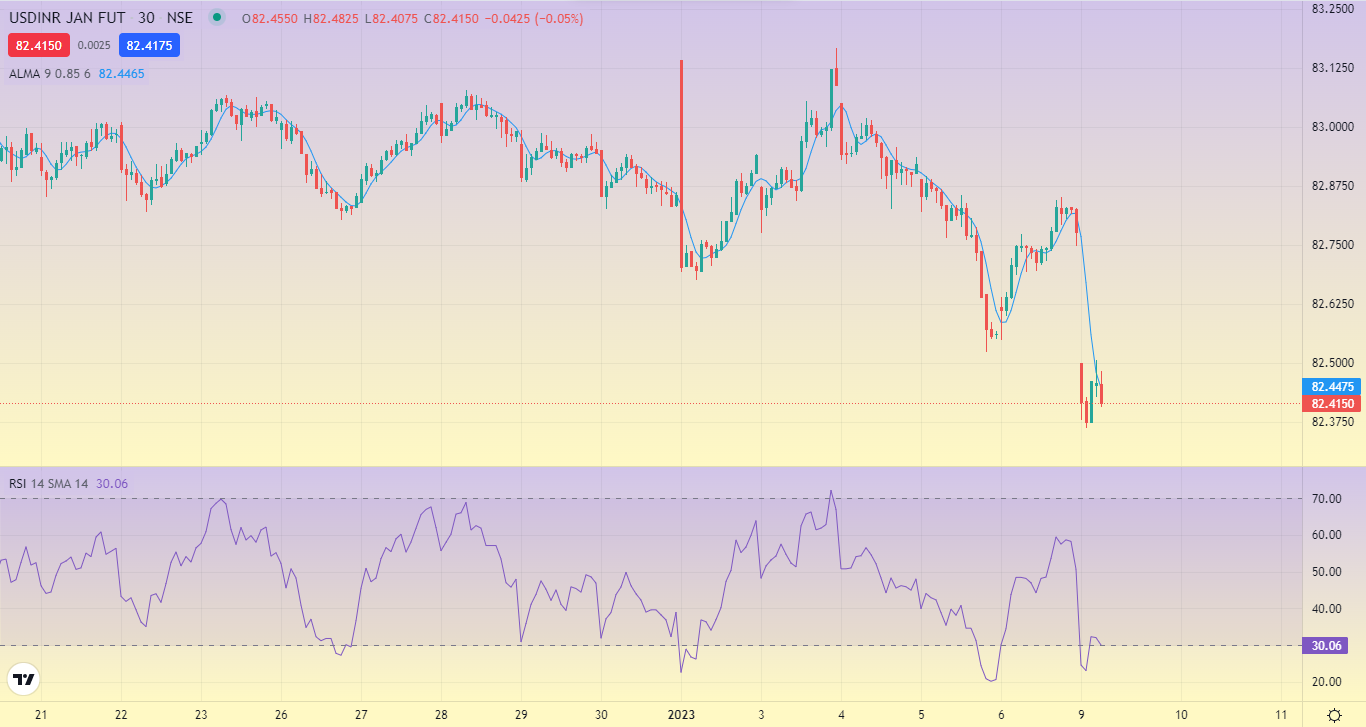
1. Relative Strength Index (RSI)
RSI determines the momentum of the asset that exhibits an asset is over-purchased, and the ALMA surpasses that asset’s price. This situation indicates and gives a ‘Sell’ signal. On the contrary, it is a strong ‘Buy signal’ if the ALMA is below the price when the RSI is oversold.
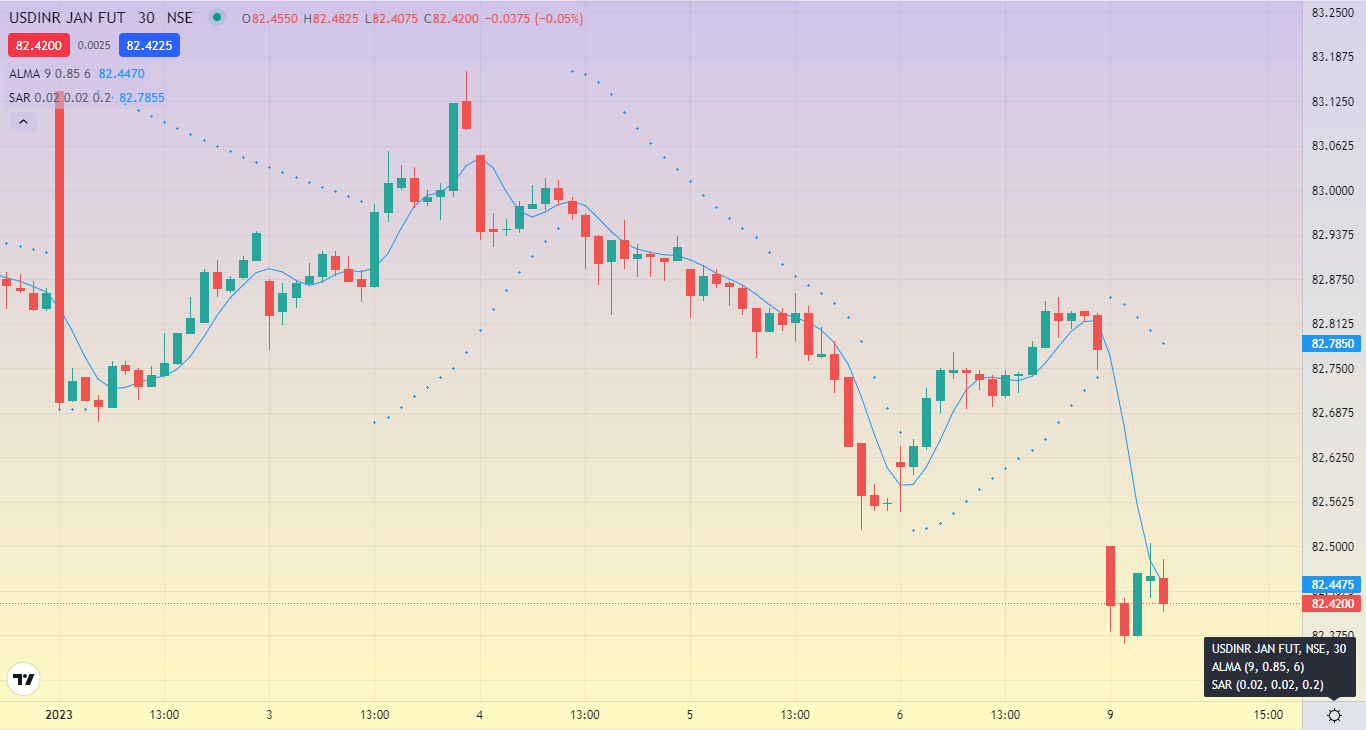
2. Parabolic Stop and Reverse (SAR)
ALMA indicator can be used in combination with the SAR when the asset’s price is greater than ALMA, whereas the SAR is below the high price. If this is the situation, it will indicate a typically strong buy signal.
However, when the price of an asset is lower than the ALMA and SAR is above the high price, it will be an indication for you to sell instead of buy.
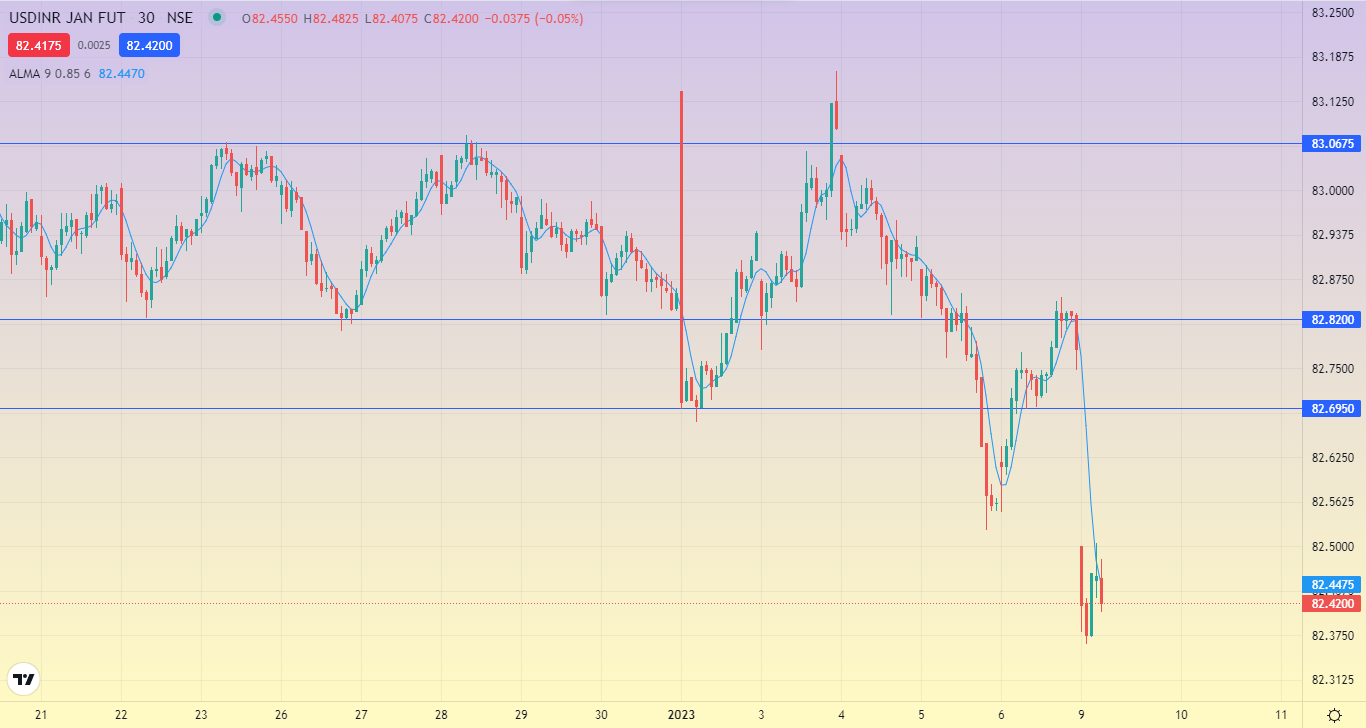
3. Resistance/Support
Identifying support and resistance levels becomes easy if you use the ALMA indicator by figuring overbought and oversold conditions in the market. Moreover, you can trade breakouts from the trend when the gap between the Arnaud Legoux Moving Average and the price diminishes or broadens.
Conclusion
Market trends reflect momentum in the price of a financial instrument. Being a diligent trader, you should know the best tools to identify market trends. The Arnaud Legoux Moving Average is one such tool that you have at your disposal.
ALMA can be applied to any market trend or counter-trend following a trading strategy. It can be used for analyzing any type of market, whether it is bearish or bullish.
Furthermore, it allows every trader to understand market insights better. At the same time, ALMA is a lagging indicator that works on historical data and is prone to generating false trading signals, much like any other technical indicator.
Thus, it is best to use ALMA in conjunction with other technical indicators like Bollinger Bands or a volume-based indicator to get the best results. You can access ALMA and hundreds of other indicators for free using Dhan which also allows you to trade directly from charts!
Like this? Then you’ll love these blogs: